Global In-Home Energy Displays Market
Global In-Home Energy Displays Market Size, Share, and COVID-19 Impact Analysis, By Product Type (Smart Displays, Standard Displays), By End-user Type (Residential Customers, Small Businesses), By Technology (Wi-Fi Enabled Displays, Bluetooth Enabled Displays), By Functionality (Real-time Energy Monitoring, Predictive Analytics), By Price Range (Low-end (<$50) Mid-range ($50 - $150)), and By Region (North America, Europe, Asia-Pacific, Latin America, Middle East, and Africa), Analysis and Forecast 2023 - 2033
REPORT COVERAGE
Global
Global In-Home Energy Displays Market Overview
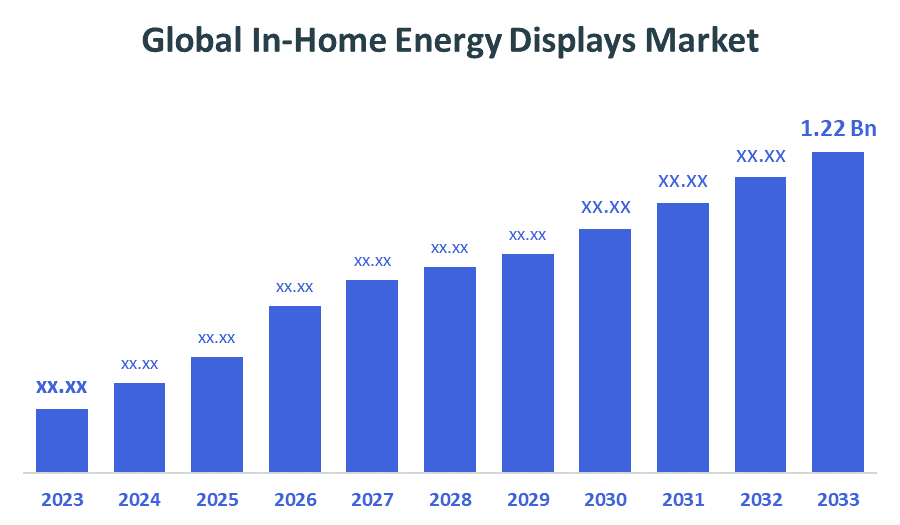
- The Global In-Home Energy Displays Market Size is Anticipated to Exceed 1.22 USD Billion by 2033, Growing at a CAGR of 9.52% from 2023 to 2033.
- The market growth is due to the rising energy costs, growing environmental concerns, and supportive government regulations.
- The integration of smart home technologies and energy management systems is enhancing functionality and user engagement, driving broader adoption. With applications across residential, commercial, and industrial sectors, IHEDs are becoming essential tools for energy optimization.
- This market's growth supports both economic and environmental objectives, reinforcing its vital role in the transition to sustainable living.
Major vendors in the global in-home energy displays market
EDF Energy, RiDC, Rainforest Automation, Geo, Lexology, Pinergy, Schneider Electric, Sailwider, Duquesne Light, Elster, and In Home Displays, and others.
Market Segment
This study forecasts revenue at global, regional, and country levels from 2023 to 2033. Decisions Advisors has segmented the in-home energy displays market based on the below-mentioned segments:
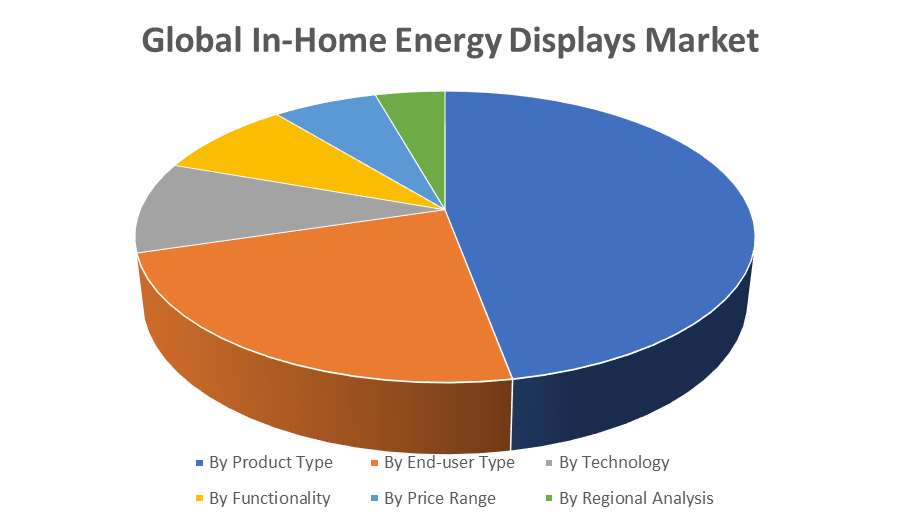
Global In-Home Energy Displays Market, By Product Type
- Smart Displays
- Standard Displays
Global In-Home Energy Displays Market, By End-user Type
- Residential Customers
- Small Businesses
Global In-Home Energy Displays Market, By Technology
- Wi-Fi Enabled Displays
- Bluetooth Enabled Displays
Global In-Home Energy Displays Market, By Functionality
- Real-time Energy Monitoring
- Predictive Analytics
Global In-Home Energy Displays Market, By Price Range
- Low-end (<$50)
- Mid-range ($50 - $150)
Global In-Home Energy Displays Market, By Regional Analysis
- North America
- US
- Canada
- Mexico
- Europe
- Germany
- UK
- France
- Italy
- Spain
- Russia
- Rest of Europe
- Asia Pacific
- China
- Japan
- India
- South Korea
- Australia
- Rest of Asia Pacific
- South America
- Brazil
- Argentina
- Rest of South America
- Middle East & Africa
- UAE
- Saudi Arabia
- Qatar
- South Africa
- Rest of the Middle East & Africa
Check Licence
Choose the plan that fits you best: Single User, Multi-User, or Enterprise solutions tailored for your needs.
We Have You Covered
- 24/7 Analyst Support
- Clients Across the Globe
- Tailored Insights
- Technology Tracking
- Competitive Intelligence
- Custom Research
- Syndicated Market Studies
- Market Overview
- Market Segmentation
- Growth Drivers
- Market Opportunities
- Regulatory Insights
- Innovation & Sustainability
Report Details
| Scope | Global |
| Pages | 170 |
| Delivery | PDF & Excel via Email |
| Language | English |
| Release | Aug 2025 |
| Access | Download from this page |